Today, give a try to Techtonique web app, a tool designed to help you make informed, data-driven decisions using Mathematics, Statistics, Machine Learning, and Data Visualization. Here is a tutorial with audio, video, code, and slides: https://moudiki2.gumroad.com/l/nrhgb. 100 API requests are now (and forever) offered to every user every month, no matter the pricing tier.
Today, we examine some nontrivial use cases for ahead::dynrmfforecasting. Indeed, the examples presented in the package’s README work quite smoothly – for randomForest::randomForest and e1071::svm – because:
-
the fitting function can handle matricial inputs (can be called as
fitting_func(x, y), also said to have ax/yinterface), and not only a formula input (can be called asfitting_func(y ~ ., data=df), the formula interface) -
the
predictfunctions associated torandomForest::randomForestande1071::svmdo have a prototype likepredict(object, newx)orpredict(object, newdata), which are both well-understood input formats forahead::dynrmf.
After reading this post, you’ll know how to adjust hundreds of different Statistical/Machine Learning (ML) models to univariate time series, and you’ll get a better understanding of how ahead::dynrmf works. If you’re not familiar with package ahead yet, you should read the following posts first:
-
Forecasting with
ahead(R version) -
Automatic Forecasting with
ahead::dynrmfand Ridge regression (R version)
The demo uses ahead::dynrmf in conjunction with R packages:
-
ranger: random forests -
xgboost: gradient boosted decision trees -
caret: functions to streamline the model training process for complex regression problems.
Installing package ahead
options(repos = c(
    techtonique = 'https://techtonique.r-universe.dev',
    CRAN = 'https://cloud.r-project.org'))

install.packages("ahead")
Packages required for the demo
library(ahead)
library(forecast)
library(ranger)
library(xgboost)
library(caret)
library(gbm)
library(ggplot2)
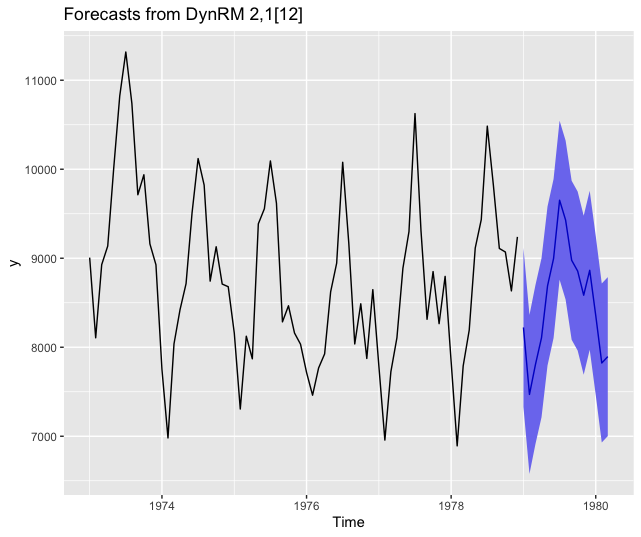
Forecasting using ahead::dynrmf’s default parameters
# ridge ------------------------------------------------------------------

# default, with ridge regression's regularization parameter minimizing GCV
z <- ahead::dynrmf(USAccDeaths, h=15, level=95)
autoplot(z)
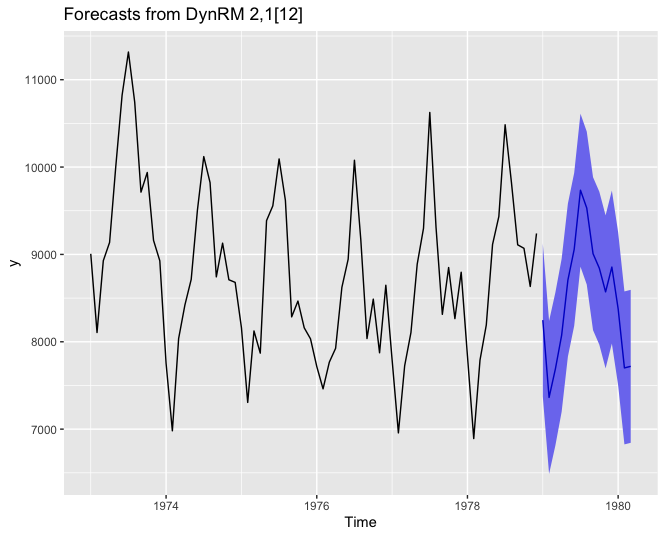
Forecasting using ahead::dynrmf and ranger
# ranger ------------------------------------------------------------------

fit_func <- function(x, y, ...)
{
  df <- data.frame(y=y, x) # naming of columns is mandatory for `predict`
  ranger::ranger(y ~ ., data=df, ...)
}

predict_func <- function(obj, newx)
{
  colnames(newx) <- paste0("X", 1:ncol(newx)) # mandatory, linked to df in fit_func
  predict(object=obj, data=newx)$predictions # only accepts a named newx
}

z <- ahead::dynrmf(USAccDeaths, h=15, level=95, fit_func = fit_func,
                    fit_params = list(num.trees = 500),
                    predict_func = predict_func)
autoplot(z)
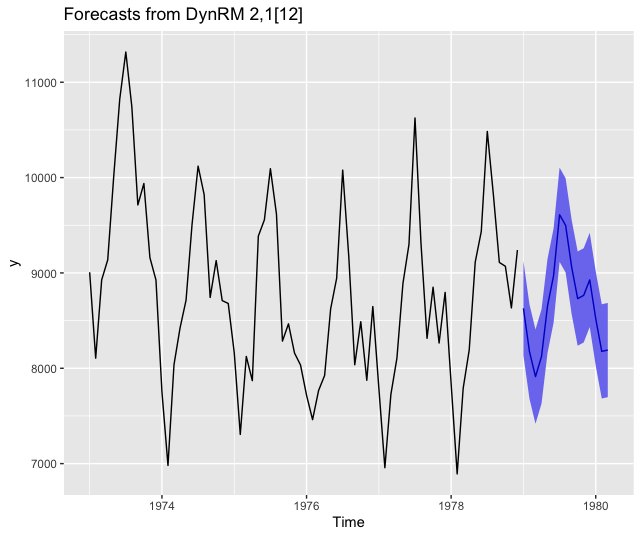
Forecasting using ahead::dynrmf and xgboost
# xgboost -----------------------------------------------------------------

fit_func <- function(x, y, ...) xgboost::xgboost(data = x, label = y, ...)

z <- ahead::dynrmf(USAccDeaths, h=15, level=95, fit_func = fit_func,
                   fit_params = list(nrounds = 10,
                                     verbose = FALSE),
                   predict_func = predict)
autoplot(z)
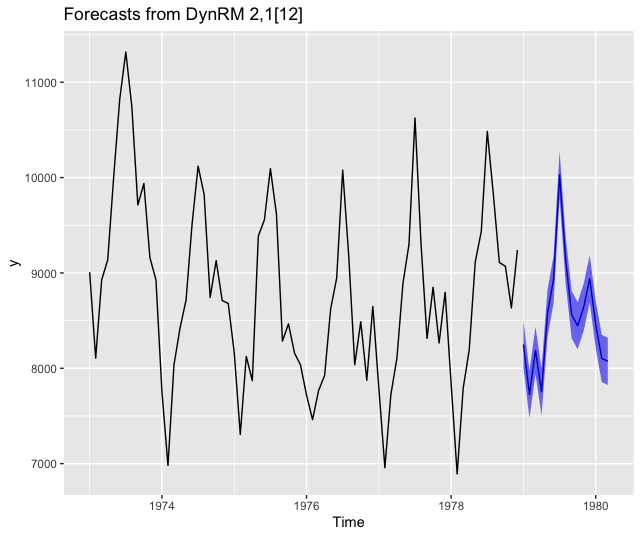
Forecasting using ahead::dynrmf and gbm through caret’s unified interface
# caret gbm -----------------------------------------------------------------

# unified interface, with hundreds of regression models
# https://topepo.github.io/caret/available-models.html

fit_func <- function(x, y, ...)
{
  df <- data.frame(y=y, x)

  caret::train(y ~ ., data=df,
               method = "gbm",
               trControl=caret::trainControl(method = "none"), # no cv
               verbose = FALSE,
               tuneGrid=data.frame(...))
}

predict_func <- function(obj, newx)
{
  colnames(newx) <- paste0("X", 1:ncol(newx))
  caret::predict.train(object=obj, newdata=newx, type = "raw")
}

z <- ahead::dynrmf(USAccDeaths, h=15, level=95, fit_func = fit_func,
                   fit_params = list(n.trees=10, shrinkage=0.01,
                                     interaction.depth = 1,
                                     n.minobsinnode = 10),
                   predict_func = predict_func)
autoplot(z)
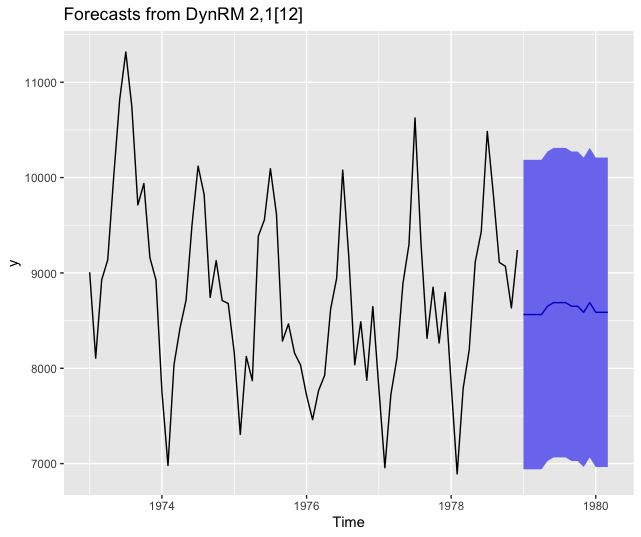
Forecasting using ahead::dynrmf and glmnet through caret’s unified interface
# caret glmnet -----------------------------------------------------------------

# unified interface, with hundreds of regression models
# https://topepo.github.io/caret/available-models.html

fit_func <- function(x, y, ...)
{
  df <- data.frame(y=y, x)

  caret::train(y ~ ., data=df,
               method = "glmnet",
               trControl=caret::trainControl(method = "none"), # no cv
               verbose = FALSE,
               tuneGrid=data.frame(...))
}

predict_func <- function(obj, newx)
{
  colnames(newx) <- paste0("X", 1:ncol(newx))
  caret::predict.train(object=obj, newdata=newx, type = "raw")
}

z <- ahead::dynrmf(USAccDeaths, h=15, level=95, fit_func = fit_func,
              fit_params = list(alpha=0.5, lambda=0.1),
              predict_func = predict_func)
autoplot(z)

Comments powered by Talkyard.