In a previous blog post,
I presented time series cross-validation with crossvalidation::crossval_ts. The most
recent version of package crossvalidation, v0.4.1, contains a new function called eval_ts.
How does crossvalidation::eval_ts work? As described in the graph below:
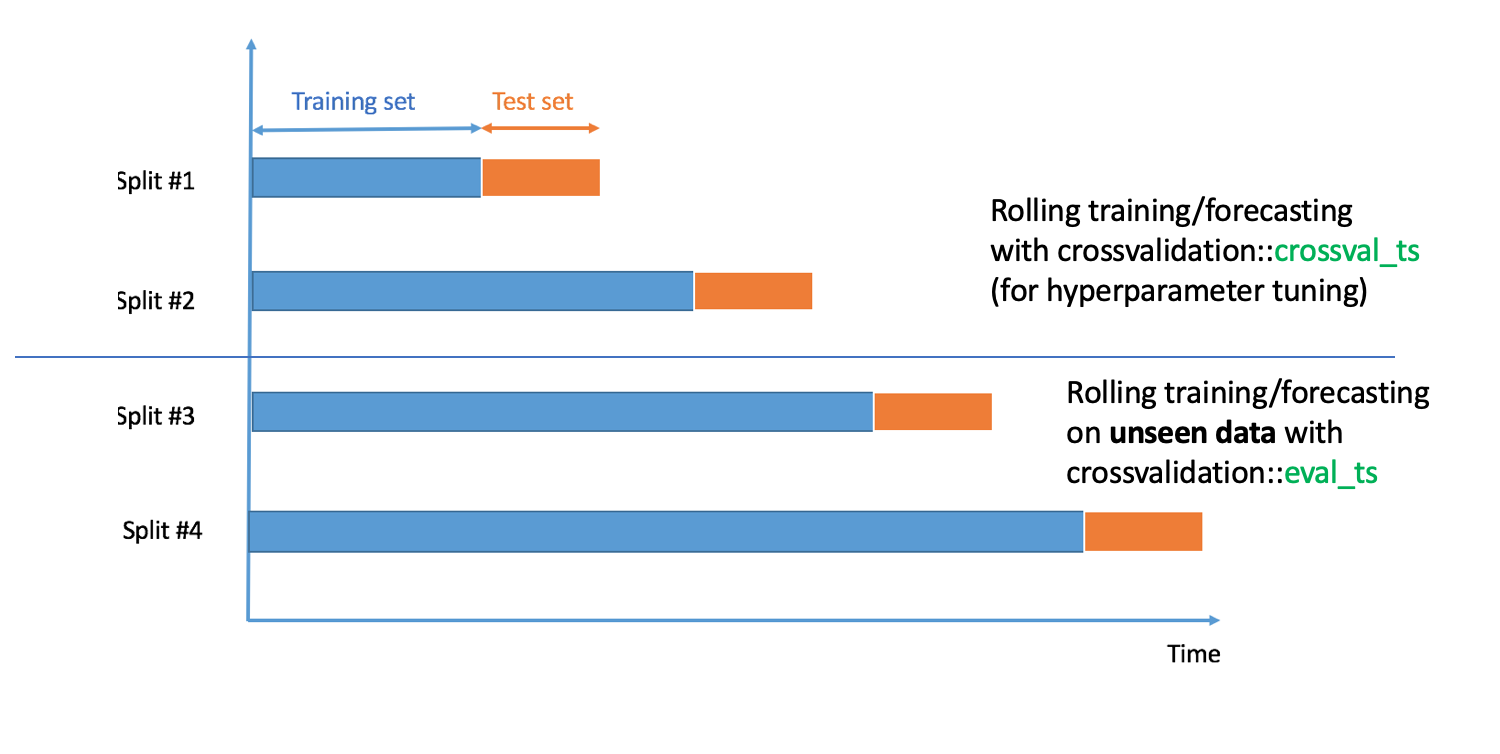
crossvalidation::crossval_ts and crossvalidation::eval_ts
have the same arguments, except,
an argument p for crossval_ts and an argument q for eval_ts. p is the percentage of original
data used for cross-validation and hyperparameter tuning, and q is the percentage of unseen data used
for model validation. In addition, and most importantly, we must have p + q = 1, to avoid overlapping
train/test/validation sets.
Here’s a concrete example of use of crossvalidation::eval_ts :
Installing packages
options(repos = c(
      techtonique = 'https://techtonique.r-universe.dev',
      CRAN = 'https://cloud.r-project.org'))

install.packages("ahead")
install.packages("crossvalidation")
install.packages("e1071")
Loading packages
library(ahead) # forecasting tool
library(crossvalidation) # cross-validation and evaluation
library(datasets) # dataset Nile
library(e1071) # for svm
Input data
y <- AirPassengers
Forecasting function
fcast_func <- function(y, h = 5, kernel=c("linear", "radial"))
 {
   kernel <- match.arg(kernel)
   ahead::dynrmf(y=y, h=h, level=95,
                 fit_func = e1071::svm,
                 fit_params = list(kernel = kernel),
                 predict_func = predict)
 }
We’ll consider that the hyperparameter is kernel, which is either “linear” or “radial”.
Error metric (Root Mean Squared Error, RMSE)
eval_metric <- function(predicted, observed)
{
   return(sqrt(mean((observed - predicted) ^ 2, na.rm = FALSE)))
}
Cross-validation on 80% of the data
With kernel = "radial"
res_cv_radial <- crossvalidation::crossval_ts(y = y,
                                             fcast_func = fcast_func,
                                             fit_params = list(kernel = "radial"),
                                             initial_window = 20,
                                             horizon = 10, p=0.8,
                                             eval_metric = eval_metric,
                                             show_progress = FALSE)
print(median(res_cv_radial))
[1] 47.29141
With kernel = "linear"
res_cv_linear <- crossvalidation::crossval_ts(y = y,
                                             fcast_func = fcast_func,
                                             fit_params = list(kernel = "linear"),
                                             initial_window = 20,
                                             horizon = 10, p=0.8,
                                             eval_metric = eval_metric,
                                             show_progress = FALSE)
print(median(res_cv_linear))
[1] 44.18955
Evaluation with the **best hyperparameter, kernel = "linear", on unseen data (q = 1 - p) **
res_eval_linear <- crossvalidation::eval_ts(y = y,
                                           fcast_func = fcast_func,
                                           fit_params = list(kernel = "linear"),
                                           initial_window = 20,
                                           horizon = 10, q=0.2,
                                           eval_metric = eval_metric,
                                           show_progress = FALSE)
print(median(res_eval_linear))
[1] 86.47903