As someone who’s been using the statistical computing language R for 15 years now, I’d been wondering if there was a way to call my favorite R functions from Python. If you’ve been asking yourself too, yes, there is a way: using rpy2.
rpy2 can be installed from the command line as:
pip install rpy2
In order to install the R packages necessary for our demo, we’ll use the following Python code snippet (that I adapted from here: http://www.pybloggers.com/2015/12/r-from-python-an-rpy2-tutorial/). This script first checks if the R packages that we need are already installed, and if not, it installs them:
import rpy2.robjects as robjects
import rpy2.robjects.packages as rpackages
from rpy2.robjects import numpy2ri
from rpy2.robjects.packages import importr
from rpy2.robjects.vectors import StrVector

import numpy as np


required_packages = ['base', 'forecast'] # list of required R packages

if all(rpackages.isinstalled(x) for x in required_packages):
    check_packages = True # True if packages are already installed
else:
   check_packages = False # False if packages are not installed

if check_packages == False: # Not installed? Then install.

    utils = rpackages.importr('utils')
    utils.chooseCRANmirror(ind=1)

    packages_to_install = [x for x in required_packages if not rpackages.isinstalled(x)]

    if len(packages_to_install) > 0:

        utils.install_packages(StrVector(packages_to_install))

    check_packages = True
If the script doesn’t work on your machine, you’ll have to install the R packages (actually, R package forecast) from the R console (as you usually do that) and continue. Now in Python, we can import all the modules that we want for our demo:
import rpy2.robjects as robjects
import rpy2.robjects.packages as rpackages
from rpy2.robjects import numpy2ri
from rpy2.robjects.packages import importr
from rpy2.robjects.vectors import StrVector

import numpy as np
Plus (still in Python), the R packages and R objects :
r = robjects.r
base = importr('base')
forecast = importr('forecast')
graphics = importr('graphics')
grdevices = importr('grDevices')
For the creation of an R time series object, we do:
base.set_seed(123) # reproducibility seed
x = r.ts(r.rnorm(n=10)) # simulate the time series
print(x)
Time Series:
Start = 1
End = 10
Frequency = 1
 [1] -0.56047565 -0.23017749  1.55870831  0.07050839  0.12928774  1.71506499
 [7]  0.46091621 -1.26506123 -0.68685285 -0.44566197
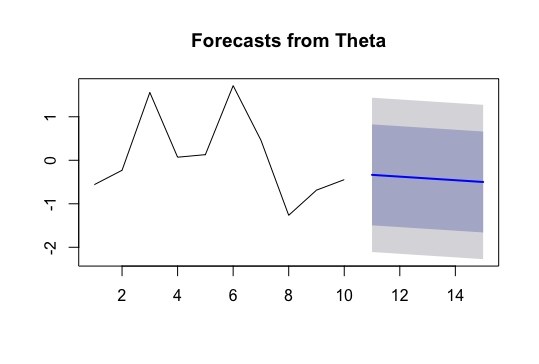
Forecasting our time series using the Theta method is done as:
# Forecasting horizon
h = 5

# Use theta for forecasting
res_thetaf = forecast.thetaf(x, h = h)

print(res_thetaf)
Point Forecast     Lo 80     Hi 80     Lo 95    Hi 95
11     -0.3349355 -1.631470 0.9615991 -2.317814 1.647943
12     -0.3759211 -1.672456 0.9206135 -2.358800 1.606958
13     -0.4169067 -1.713441 0.8796279 -2.399785 1.565972
14     -0.4578923 -1.754427 0.8386423 -2.440771 1.524986
15     -0.4988779 -1.795413 0.7976567 -2.481757 1.484001
We can even plot the time series forecast (this has been tested on macOS, hopefully it works on your machine too):
grdevices.X11()
graphics.plot(res_thetaf)
For those who wonder if this is an ancient-medieval-technique-revealed-by-T (and are interested in hacking all my social media), nope it isn’t. You can find out in the official package documentation. I’d be interested to hear if there are Python packages similar to rpy2. If yes, then drop me an email!
Note: I am currently looking for a gig. You can hire me on Malt or send me an email: thierry dot moudiki at pm dot me. I can do descriptive statistics, data preparation, feature engineering, model calibration, training and validation, and model outputs’ interpretation. I am fluent in Python, R, SQL, Microsoft Excel, Visual Basic (among others) and French. My résumé? Here!